The Impact of
Deprivations
on Poverty
A N A L Y S I S O F H A R R I S C O U N T Y
a collaboration with Kristen Campbell, Liza Hurtubise, Kelley Reece, Kristingail Robinson, Jessica Ruland, & Edith Santamaria
Hypothesis
R E S E A R C H
This study examines the relationship between poverty in Harris County and social conditions using a random effects regression model.
In particular, this study focuses on five key social indicators associated with poverty, including health care insurance, education, internet access, housing, and contact with the criminal justice system.
CONTROL VARIABLES
-
number of individuals between the ages of 18-64 divided by the total population
-
we used percentage of females of the total population within each PUMA (Census reports gender in binary only)
-
total number of people in Census racial group (African American, Asian, and other races) divided by total population for each PUMA
-
This variable includes the percentage of 16-year-old or older civilians in the labor force.
R E S E A R C H
Empirical Model
Ratio of Povertyit= 𝛽0 +
𝛽1uninsuredit + 𝛽2eduit +
𝛽3houseit + 𝛽4nointernetit +
𝛽5incarit+𝜖 it
R E S E A R C H
Variables & Descriptive Statistics
Data Sources
American Community Survey (1 yr est.)
Texas Office of Court Administration Statistics compiled by Texas ` Justice Coalition
About the Data Set
Type: Panel Data
Geographic level: Public Use Microdata Area
Time: 2015 through 2019 (5 years)
No. of Observations: 184
Models Included in Study
OLS
Fixed Effects
Random Effects
Dependent Variable
Ratio of Income to Poverty
Independent Variables
Percent of Population Without Health Insurance
Percent of Population Over 25 Without HS Diploma
Percent of Homeowners of Occupied Units
Percent of Population Without Internet Access
Percent of Population With Court Case
Control Variables
Race (Percent of Population that identifies as African American, Asian, & Others)
Age (Percent of Population between 18-64)
Gender (Percent of Population that identifies as female)
For each percent increase in total population that is
uninsured, there is a 0.2% increase
involved in court system, there is a 4.58% increase
not a high school graduate, there is a 0.7% increase
a home owner, there is a 0.3% decrease
in the Ratio of Poverty Indicator, holding all other variables constant.
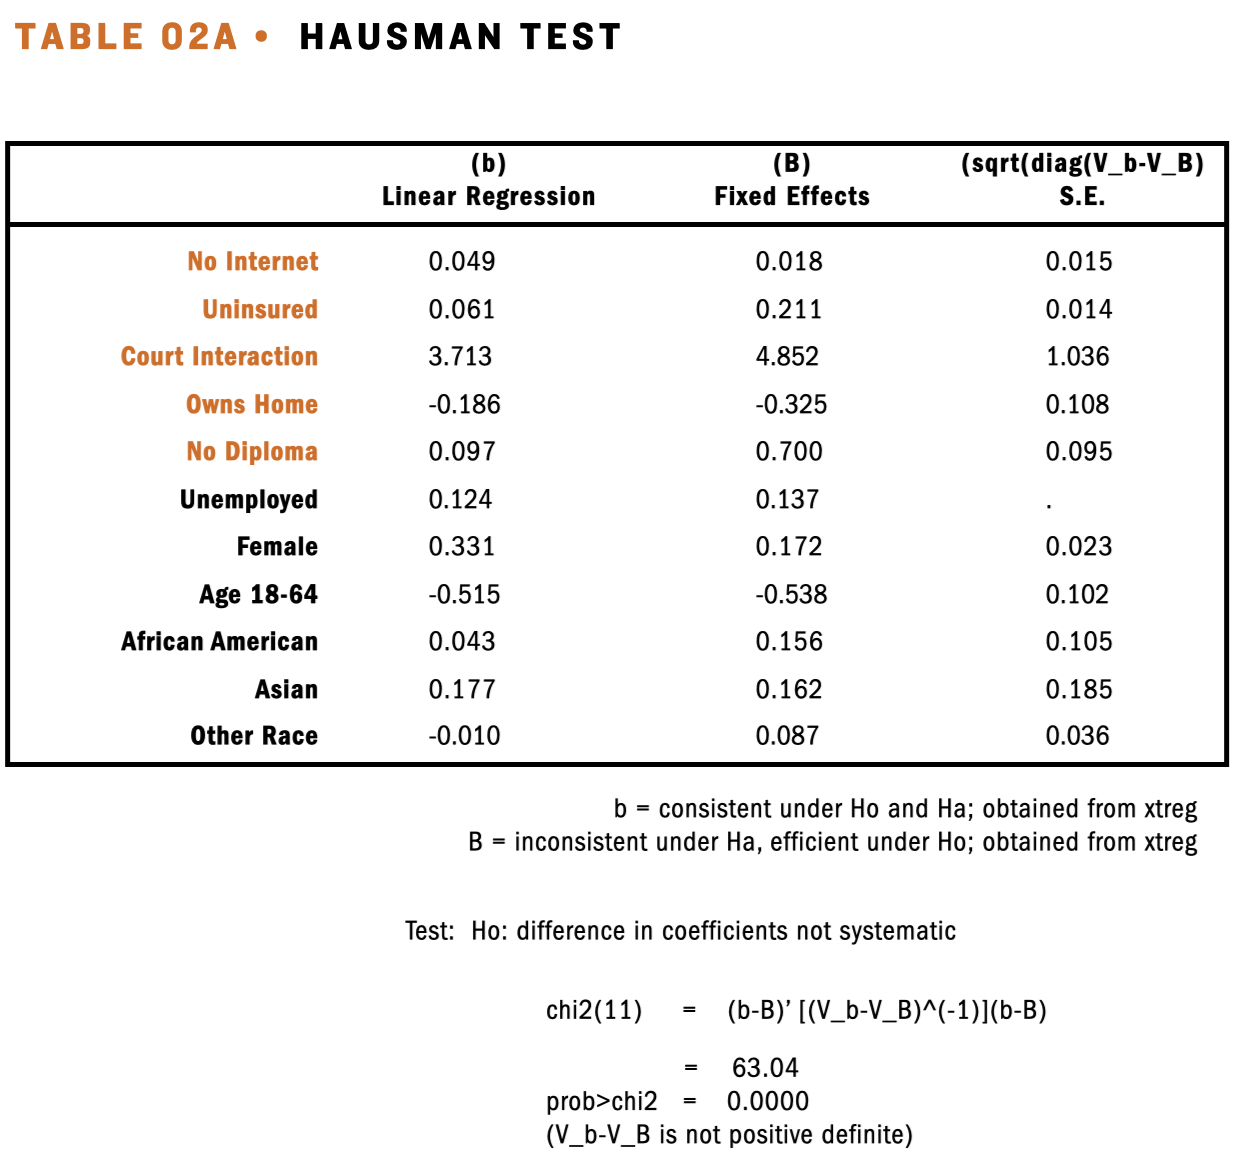
The Random Effects model was determined to be the best after conducting Hausman and Breusch-Pagan post-estimation tests.
R E S U L T S
Findings & Interpretation
The American Community Survey (1 yr est.) divides those in poverty in three different groups.
0-100% - represents people living at 100% of their income is under the poverty limit
100% - 200% - is all of the people who have a portion of their income above the poverty line but who are still struggling.
0-200% - covers the spectrum of individuals earning less than the federal poverty limit to those who make more and are still struggling.
Table 4 shows results from multiple random effects models in which we experimented with the differences in coefficients if variables were left in or out. Some of the main variables, namely uninsured, home ownership, and no diploma, remained significant.
Public healthcare option was equally significant in all cases, no matter the variables. The literature supports this as many people who receive public assistance usually qualify for public healthcare in the United States. To be eligible for Medicaid in Texas, a family of 4 would need to make $52,470, which is 199.9% of the poverty level for the state (TMB, n.d.).
Looking at the internet also proved interesting, and although not always significant, we decided to see if positive access was in any way more significant. Access to the internet is not significant except in the equations with minimal variables, namely only no insurance, public healthcare, and interaction with court cases. This was such an interesting find that we ran Table 5 in order to look at the no internet variable in greater depth. The finding that people with access had a negative effect on poverty is also supported in the literature, but that it also made the interaction with court cases insignificant was equally surprising.
As evidenced in Table 5, not having access to the internet is significant when it is the only variable, or when it is run with uninsured, homeownership, and not having a diploma. As seen in previous regressions, it is not when run with court interactions. Still, interestingly it is not significant when run with all of the same variables that it is significant with individually. Again this may possibly be due to multiple collinearity with the other variables or with the variable itself. We may need to look at how having access to the internet affects poverty and how that may be used in the growing technical age how this may become more or less significant.
Limitations
R E S E A R C H
REVERSE CAUSALITY
Conditions highlighted in this study are both a cause and consequence of poverty. To rectify this, we would need to identify a variable that affects the outcome of IV’s independently.
MISSING COHORT DATA
In an ideal world, we would have liked to use a data set that followed specific cohorts of individuals over time to get a better sense of causal impacts of the variables included in this study.
DISAGGREGATED RACE DATA
Census dataset had too many missing observations for other racial groups in the PUMAs included in the study, and thus, excluded like LatinX, Pacific Islander, and others that may have impacted our results.
Policy Implications
R E C O M E N D A T I O N S
Reducing poverty in Harris County will require investing in infrastructure that supports the social conditions that are imperative to an individual's ability to thrive in an urban society. Investing in policies that support access to healthcare, education, housing and technology are likely to narrow income inequality and improve upward social mobility by allowing a greater percentage of the population to harness the economic opportunities available in this region.
Medicaid expansion
Texas should make Medicaid expansion a legislative priority to reduce the degree of poverty in Harris County. Expanding Medicaid will narrow the large uninsured gap, making access to preventative care accessible while reducing high out of pocket costs for chronic illness interventions.
Policymakers should prioritize adequate funding for Texas school children
The Census’s lack of information about Harris County’s LatinX population creates significant problems when their children comprise more than half its student population. Schools rely on accurate counts so that they get the proper amount of funding and meet their students’ needs.
Invest in new forms of housing or repurpose buildings
Governments can examine varied forms of homeownership e.g., townhomes, condos, ADUs, tiny homes, etc. The kinds of homeownership developments are more affordable and can provide lifelong stability -- thereby reducing poverty and improving the quality of life for the residents throughout generations.
Make the Internet a publicly-owned utility.
Cost is the most commonly cited reason why people do not have an internet subscription. The U.S.’s long-running service provider duopoly has created a market that excludes already vulnerable populations. Due to the lack of competition, IPs are free to make rates as high as they like. Policymakers could pass policies that make the Internet a publicly owned utility. Greater competition would lower prices for everyone, and more Americans could get online to function in modern society.
Reduce licensing restrictions for certain occupations & ban cash bail and other punitive fees
Since collateral consequences of criminal justice involvement impact individuals’ employment prospects the most, the state could greatly alleviate some of these strains by addressing licensing restrictions for certain occupations, moving away from cash bail systems, and reducing the reliance on fees and fines. The state would greatly benefit by providing additional resources to those with criminal justice system interactions to prevent future system involvement.
References
DATAUSA, “Harris County, TX” DATAUSA (2021) https://datausa.io/profile/geo/harris-county-tx.
United States Census Bureau. 2015-2019. “American Community Survey, 1-Year Estimates”, www.census.gov/programs-surveys/acs/.
Mills, C. Wright (13 April 2000). The Sociological Imagination. Oxford University Press
United Way of Texas, “ALICE Budgets by County” United Way of Texas (2018) https://www.uwtexas.org/sites/uwtexas.org/files/18UW_ALICE_Report_TX_Budgets_8.27.18%20%281%29.pdf
Christopher, Andrea S, David U Himmelstein, Steffie Woolhandler, and Danny McCormick. “The Effects of Household Medical Expenditures on Income Inequality in the United States.” American journal of public health. American Public Health Association, March 2018. https://www.ncbi.nlm.nih.gov/pmc/articles/PMC5803800/.
Khullar, D., & Chokshi, D. (2018, October). Health, Income and Poverty: Where Are We and What Could Help. Health Affairs. https://www.healthaffairs.org/do/10.1377/hpb20180817.901935/full/HPB_2017_RWJF_05_W.pdf
Garfield, R., Orgera, K., & Damico, A. (2021, January 21). The Coverage Gap: Uninsured Poor Adults in States that Do Not Expand Medicaid. Kaiser Family Foundation. https://www.kff.org/medicaid/issue-brief/the-coverage-gap-uninsured-poor-adults-in-states-that-do-not-expand-medicaid/.
Bureau, US Census. “Why We Ask About...Health Insurance Coverage.” Why We Ask About... Health Insurance Coverage | American Community Survey | US Census Bureau. Accessed March 25, 2021. https://www.census.gov/acs/www/about/why-we-ask-each-question/health/
Brown, Phillip. “Education, Opportunity and the Prospects for Social Mobility: Education and Social Mobility.” British Journal of Sociology of Education 34, no. 5-6 (2013): 678–700.
Chetty, Raj, Nathaniel Hendren, Patrick Kline, and Emmanuel Saez. “Where Is the Land of Opportunity? The Geography of Intergenerational Mobility in the United States.” The Quarterly Journal of Economics 129, no. 4 (2014): 1553–1623. https://doi.org/10.1093/qje/qju022.
World Economic Forum. 2020. “Global Social Mobility Index 2020.” World Economic Forum. https://www.weforum.org/reports/global-social-mobility-index-2020-why-economies-benefit-from-fixing-inequality.
Miltko, Caelin Moriarity. 2007. “What Shall I Give My Children”: Installment Land Contracts, Homeownership, and the Unexamined Costs of the American Dream. The Chicago Law Review 87:2274, 2275.
Hutto, Nathan, Jane Waldfogel, Neeraj Kaushal, and Irwin Garfinkel. March 2011. Improving the Measurement of Poverty. Social Service Review 85(1): 39–74. doi: 10.1086/65912.
U.S. Department of Housing and Urban Development. 2020.“Comprehensive Housing Affordability Strategy data (CHAS Data).” Office of Policy Development and Research. Available at https://www.huduser.gov/portal/datasets/cp.html.
Bach, A, and T Wolfson. 2011. “Poverty, Inequality, and the Social and Political Effects of the Digital Divide.”
Unpublished Manuscript, Department of Journalism and Media Studies, Rutgers.Hart, Kim. 2018. “The Homework Divide: 12 Million Schoolchildren Lack Internet.” Axios. December 1. https://www.axios.com/the-homework-gap-kids-without-home-broadband-access-3ad5909f-e2fb-4208-b4d0-574c45ff4fe7.html.
Anderson, Monica, and Andrew Perrin. 2020. “Nearly One-in-Five Teens Can't Always Finish Their Homework Because of the Digital Divide.” Pew Research Center. Pew Research Center. May 30. https://www.pewresearch.org/fact-tank/2018/10/26/nearly-one-in-five-teens-cant-always-finish-their-homework-because-of-the-digital-divide/.
Tomer, Adie, Elizabeth Kneebone, and Ranjitha Shivaram. 2018. “Signs of Digital Distress: Mapping Broadband Availability and Subscription in American Neighborhoods.” Brookings. Brookings. May 7. https://www.brookings.edu/research/signs-of-digital-distress-mapping-broadband-availability/
Matthews, John, and Felipe Curiel. 2019. “Criminal Justice Debt Problems.” American Bar Association. November 30. https://www.americanbar.org/groups/crsj/publications/human_rights_magazine_home/economic-justice/criminal-justice-debt-problems/
Texas Department of Public Safety. “Failure to appear and failure to Pay (FTA/FTP)”. (n.d.). https://www.dps.texas.gov/section/driver-license/faq/section-8-failure-appear-and-failure-pay-ftaftp.
Pager, Devah. "The Mark of a Criminal Record." American Journal of Sociology 108, no. 5 (2003): 937-75. Accessed April 8, 2021. doi:10.1086/374403
Rabuy, Bernadette, and Daniel Kopf. “Detaining the Poor: How Money Bail Perpetuates an Endless Cycle of Poverty and Jail Time.” Prison Policy Initiative, 2016. Accessed April 8, 2021. http://www.jstor.org/stable/resrep27303


